

Dubai Real Estate Market Review: January 2026
Land transactions in January 2026 was 56.4% of the total transactions value. The market activity increased by AED 50 billion over January 2025, 92% YoY.
The Real Estate Report
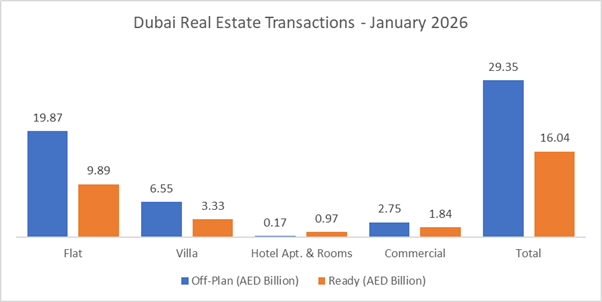
January 2026 closed with a total traded value of AED104.09B across 21,707 transactions, nearly double January 2025’s AED54.08B (+92.5% YoY). The month’s headline feature was Land, which accounted for the majority of value, while Off-Plan remained the strongest built-property engine by traded value.
| Category | Off-Plan (AED Billion) | Ready (AED Billion) |
| Flat | 19.87 | 9.89 |
| Villa | 6.55 | 3.33 |
| Hotel Apt. & Rooms | 0.17 | 0.97 |
| Commercial | 2.75 | 1.84 |
| Total | 29.35 | 16.04 |
Market Composition
| Segment | Value | Share of January Total |
| Off-Plan | AED29.35B | 28.2% |
| Ready | AED16.04B | 15.4% |
| Land | AED58.70B | 56.4% |
| Total | AED104.09B | 100% |
Off-Plan Market Performance
Total Off-Plan Value: AED29.35B (28.2% of the month)
Off-plan was led overwhelmingly by Flats, which made up over two-thirds of off-plan value.
| Category | Value | Share of Off-Plan |
| Flats | AED19.87B | 67.7% |
| Villas | AED6.55B | 22.3% |
| Commercial | AED2.75B | 9.4% |
| Hotel Apt. & Rooms | AED0.17B | 0.6% |
January’s off-plan market was essentially a flat-driven month, with villas a solid secondary pillar and commercial meaningful but clearly third. The highest ticket value for flats was Island 2 – AED80.0M, and for villas was The World – AED71.44M.
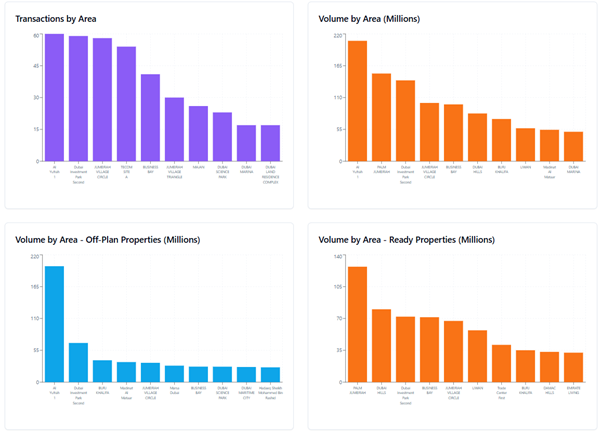
Top Performing Areas
| Area | Transactions |
| Damac Islands | 1,081 |
| Madinat Al Mataar | 672 |
| Dubai Islands | 648 |
| Dubai Land Residence Complex | 638 |
| Jumeirah Village Circle | 628 |
| Area | Value Traded (AED Billion) |
| Damac Islands | 3.61 |
| Business Bay | 2.96 |
| Dubai Islands | 2.03 |
| Dubai Creek Harbour | 1.36 |
| Madinat Al Mataar | 1.32 |
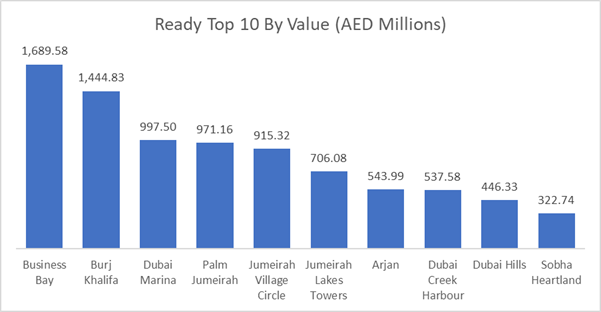
Ready Market Performance
Total Ready Value: AED16.04B (15.4% of the month)
Ready also skewed toward flats, but with a noticeably higher share for Hotel Apt. & Rooms versus off-plan.
| Category | Value | Share of Ready |
| Flats | AED9.89B | 61.7% |
| Villas | AED3.33B | 20.8% |
| Commercial | AED1.84B | 11.5% |
| Hotel Apt. & Rooms | AED0.97B | 6.0% |
Ready demand remained broad-based, with flats leading, and hotel/room product showing a more material footprint than in off-plan. The highest ticket value for flats was Jumeirah Bay – AED71.90M,and for villas was Palm Jumeirah – AED220.0M.
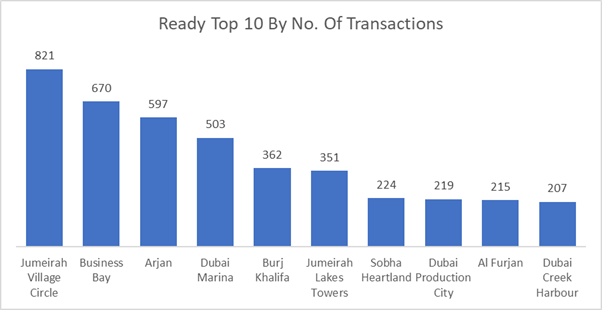
Top Performing Areas
| Area | Transactions |
| Jumeirah Village Circle | 821 |
| Business Bay | 670 |
| Arjan | 597 |
| Dubai Marina | 503 |
| Burj Khalifa | 362 |
| Area | Value Traded (AED Billion) |
| Business Bay | 1.69 |
| Burj Khalifa | 1.44 |
| Dubai Marina | 1.00 |
| Palm Jumeirah | 0.97 |
| Jumeirah Village Circle | 0.92 |
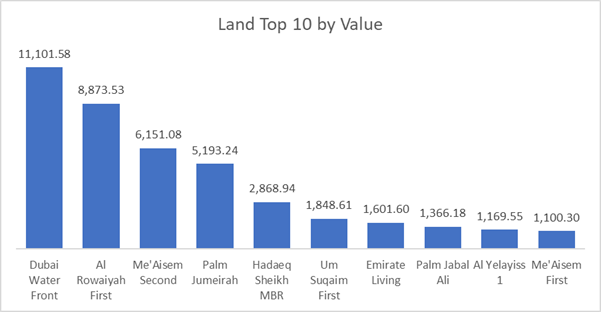
Land Market Performance
Total Land Value: AED58.70B (56.4% of the month)
Land didn’t just lead, it defined January. This is the core reason the overall month printed at AED104.09B and delivered the +92.5% YoY jump.
| Area | Value Traded (AED Bn) |
| Dubai Water Front | 11.10 |
| Al Rowaiyah First | 8.87 |
| Me’Aisem Second | 6.15 |
| Palm Jumeirah | 5.19 |
| Hadaeq Sheikh MBR | 2.87 |
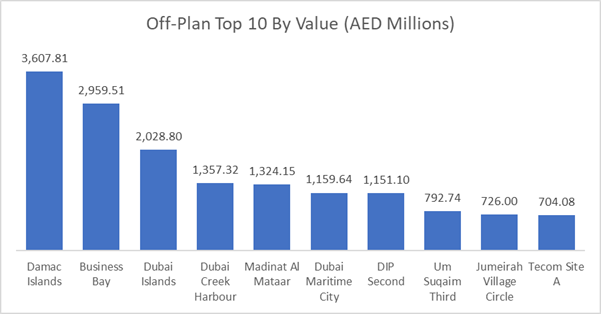
Top Projects by Value Traded
Off-Plan (Top 10 Total: AED5.70B)
The top 10 off-plan projects collectively contributed ~19.4% of total off-plan value (AED5.70B out of AED29.35B), indicating a meaningful concentration in the biggest launches.
Top 3 by value:
- Nourelle — AED751.4M
- Lumena by Omniyat — AED682.1M
- Hado By Beyond — AED659.2M
Ready (Top 10 Total: AED1.56B)
The top 10 ready projects contributed ~9.7% of ready value (AED1.56B out of AED16.04B), implying ready demand is more distributed.
Top 3 by value:
- EOME — AED220.0M
- Bay Square — AED190.45M
- Sensoria at Five Luxe — AED179.67M
On The Micro Level
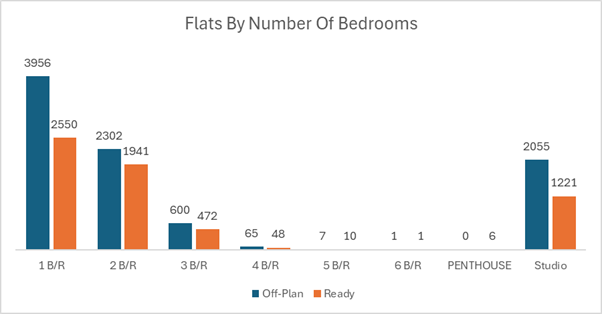
Flats are a 1BR + Studio market in both off-plan and ready, with ready showing a slightly stronger 2BR mix.
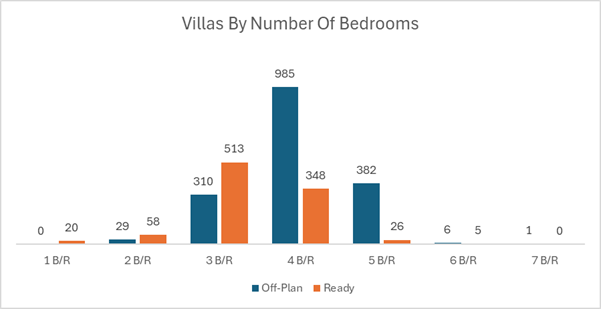
Off-plan villa demand is decisively family-upgrade (4–5BR), while ready is centered on 3–4BR liquidity.
Market Insights & Outlook
January 2026 printed an exceptional headline (AED104.09B, +92.5% YoY) primarily because Land dominated the value stack (56.4%), amplified by at least one ultra-ticket transaction. Underneath that, the built market stayed structurally consistent: flats led both off-plan and ready, with off-plan showing stronger recently launched concentration (top projects = ~19.4% of off-plan value) and ready reflecting broader distribution (top projects = ~9.7% of ready value). If land intensity normalizes in the following months, the key question becomes whether off-plan launch velocity (e.g., Damac Islands scale) can sustain overall market value at elevated levels without relying on land’s outsized contribution.